=========
 =========

This folder has the documents showing how to step wisely do the data organization.
]]>Isoprene can be detected by the benzene CIMS.But this appears as two ions in the mass spec C5H8 & C11H14 with the later being much higher in amount.
[1] Sharkey, Thomas D., and Sansun Yeh. “Isoprene emission from plants.” Annual review of plant biology 52.1 (2001): 407-436.
]]>Here comes the reportgenerator package in MATLAB to rescue us from these issues. It generates a report from a given code. But who makes a report in MATLAB, hmm? I use LaTeX sometimes, Word though for smaller reports. But yeah, you heard it true: MATLAB can generate reports, but we will use this technique to create PowerPoint files from the ton of images that are produced in the codes.
]]>=========
=========
======
Distillation is the most frequent unit operation for converting liquid mixtures into valuable and high-purity products.It is usually the most economical method of separating liquids,superior to the extraction,adsorption and crystallization techniques.Solving the Material balance, Equilibrium, Summation, and Heat balance equations step-by-step is the standard method for resolving a common multi-component distillation problem. Shortcut methods are still helpful in the initial design work and as a tool for defining problems for computer simulation, even though computer programs are typically available for the rigorous solution of the MESH equations. This application uses the Fenske-Underwood-Gilliland (FUG) method, a widely used suitable distillation technique.
User interface in the Application for choosing the compounds:
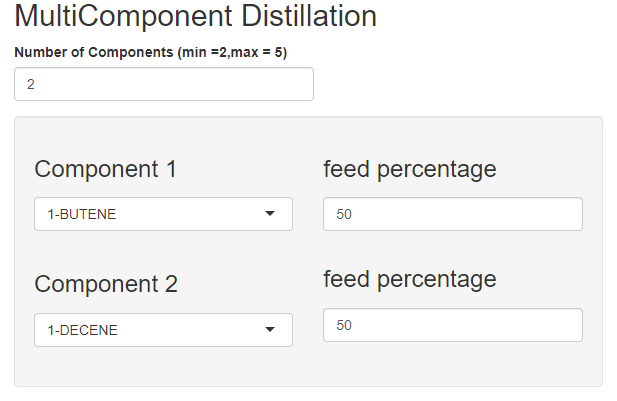
In this we need to input the number of components for the distillation column max upto 5 components
The Component-1 and Component-2 are the two compounds which we have to choose to calculate the volatility and observer their relative volatility for the range of Temperature
In this box we need to enter the feed percentage of all the components which sums to 100%
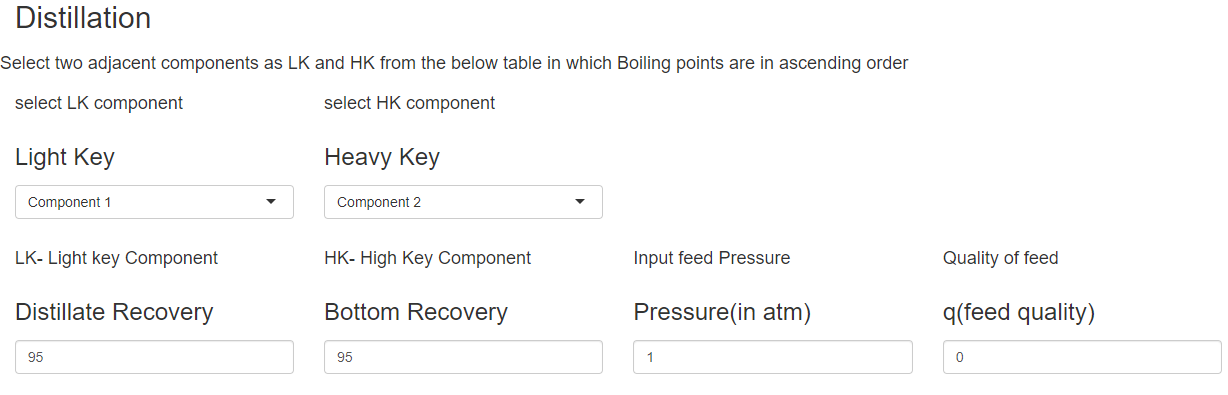
Choose the component next to the light key which has the immediate highest boiling point which will be recovered in the bottoms from the order in the table (Data Table of the constants and Boiling Points in ascending order)
Choose the component which you want to recover in the distillate from the order in the table (Data Table of the constants and Boiling Points in ascending order)
Choose the component next to the light key which has the immediate highest boiling point which will be recovered in the bottoms from the order in the table (Data Table of the constants and Boiling Points in ascending order)
Enter the purity of the distillate you want to obtain
Enter the purity of the bottoms you want to obtain
The pressure at the input of the feed
The quality of the feed based on its condition supersaturate or saturated
This table is the new order of the components which we have to choose for the Light key and Heavy Key they have to together for the separation to achieve
]]>======
Relative volatility is a measure comparing the vapor pressures of the components in a liquid mixture of chemicals. This quantity is widely used in designing large industrial distillation processes.In effect, it indicates the ease or difficulty of using distillation to separate the more volatile components from the less volatile components in a mixture. By convention, relative volatility is usually denoted as
User interface in the Application for choosing the compounds:
In this we need to input the number of components for the distillation column max upto 5 components
The Component-1 and Component-2 are the two compounds which we have to choose to calculate the volatility and observer their relative volatility for the range of Temperature
In this box we need to enter the feed percentage of all the components which sums to 100%
Choose the component next to the light key which has the immediate highest boiling point which will be recovered in the bottoms from the order in the table (Data Table of the constants and Boiling Points in ascending order)
Choose the component which you want to recover in the distillate from the order in the table (Data Table of the constants and Boiling Points in ascending order)
Choose the component next to the light key which has the immediate highest boiling point which will be recovered in the bottoms from the order in the table (Data Table of the constants and Boiling Points in ascending order)
Enter the purity of the distillate you want to obtain
Enter the purity of the bottoms you want to obtain
The pressure at the input of the feed
The quality of the feed based on its condition supersaturate or saturated
This table is the new order of the components which we have to choose for the Light key and Heavy Key they have to together for the separation to achieve
]]>